
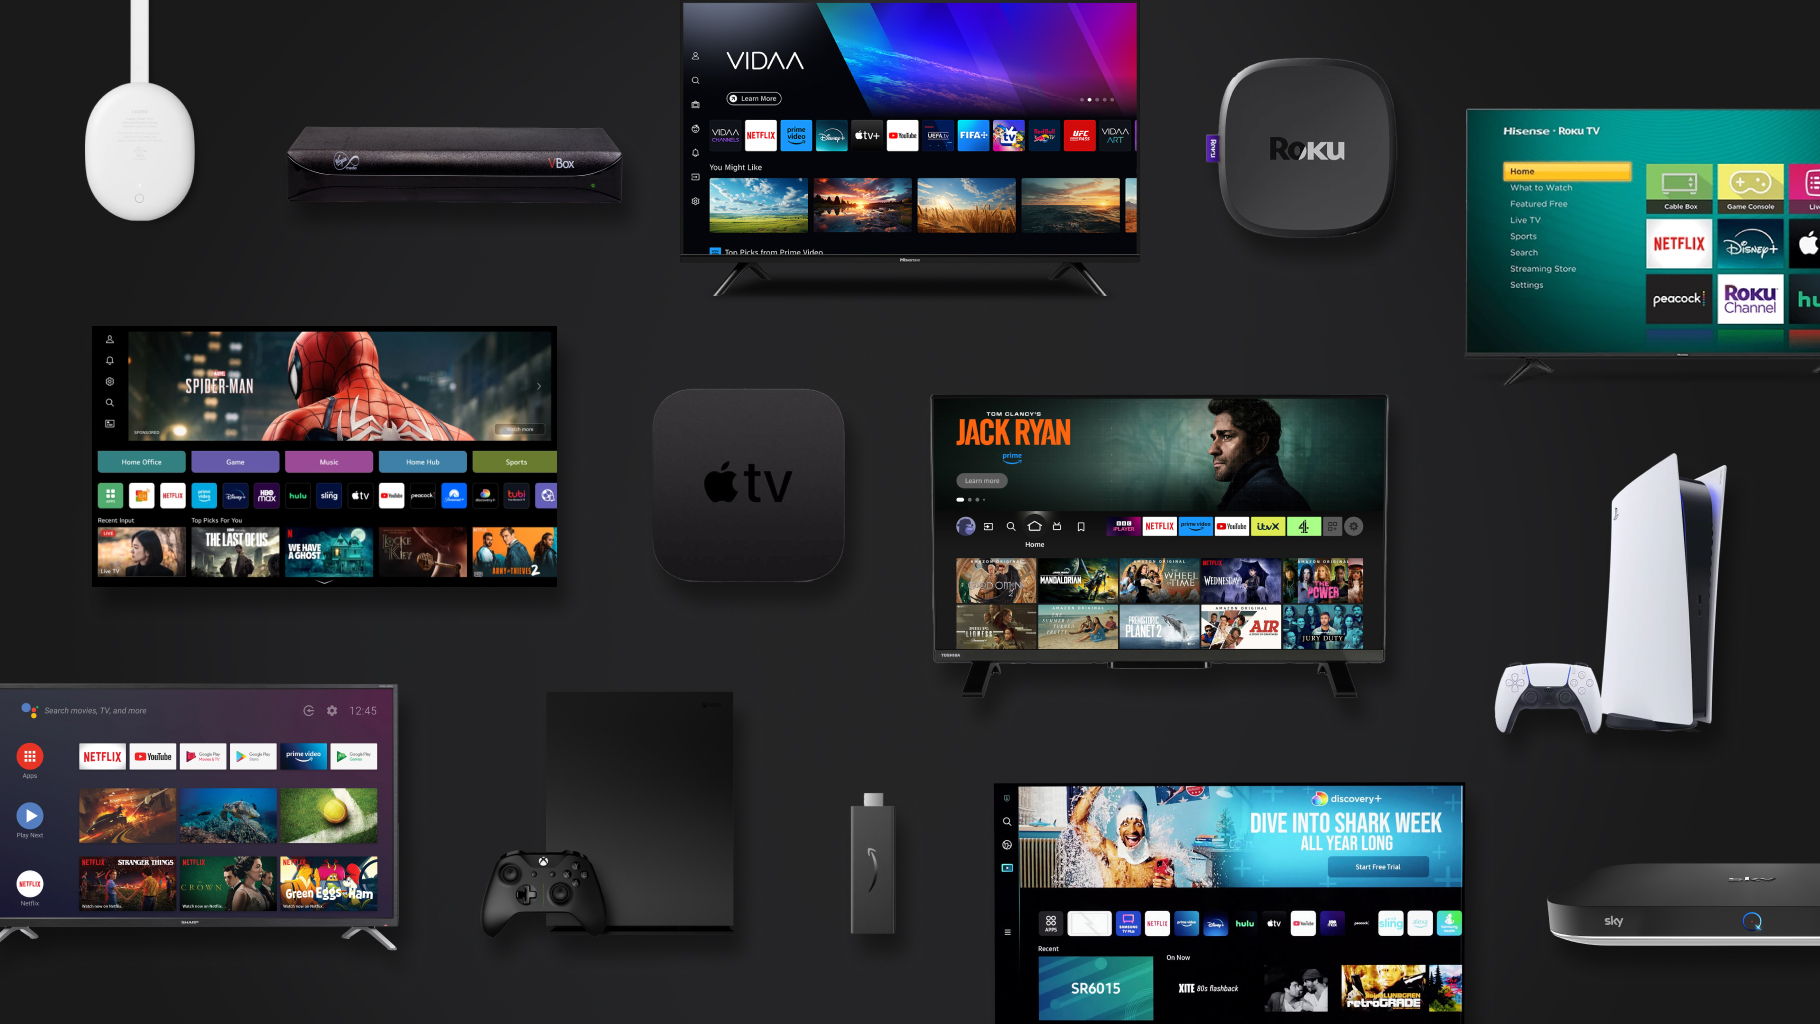
- Extensive benchmarking of 14 streaming devices
- In depth testing across 14 devices
- Streamlined report with clear insights
- Actionable data driven product improvements
We’d previously worked with Amazon in 2020 on a successful benchmarking project. Thanks to our approach and commitment to answering the brief, they came back to us with a fresh set of challenges. These involved testing two key areas of their Fire TV devices which have sold over 200 million units globally.
The first part of this new brief was to assess the prominence of Public Service Broadcasting (PSB) apps such as BBC iPlayer, ITVX, Channel4, My5, STV and S4C on Amazon Fire devices against UK competitors. The second, to discover how Fire TV’s product features ranked against other UK streaming services. The results of our work would then be used to give a clear insight into how Fire TV products were positioned in the marketplace and pinpoint areas for improvement.
Three months of intense research followed using 14 different streaming devices, with 231 tests conducted on each. This culminated in the creation of a benchmarking document tailored to Amazon’s exact requirements.
Researching the brief
Our UX team began by working with Amazon to gain a deeper understanding of what criteria we needed to benchmark Fire TV against. For example, how easy was it to download PSBs, their on-screen prominence and how this changed during use? While to compare Fire TV against other Subscription Video on Demand (SVOD) services, we looked at factors such as the availability of pre-installed apps, ease of navigation and overall performance.
Armed with this information, our senior data analyst worked on the data algorithms and methodologies required. In addition, we assessed the best ways to visualise results to meet Amazon’s reviewing strategies. This saw us agree on research and insight-gathering techniques that produced holistic data-driven results. These required complex calculations based on pre-agreed units of scoring, which also had to work in reverse as both highest and lowest scores could be deemed best depending on the test.
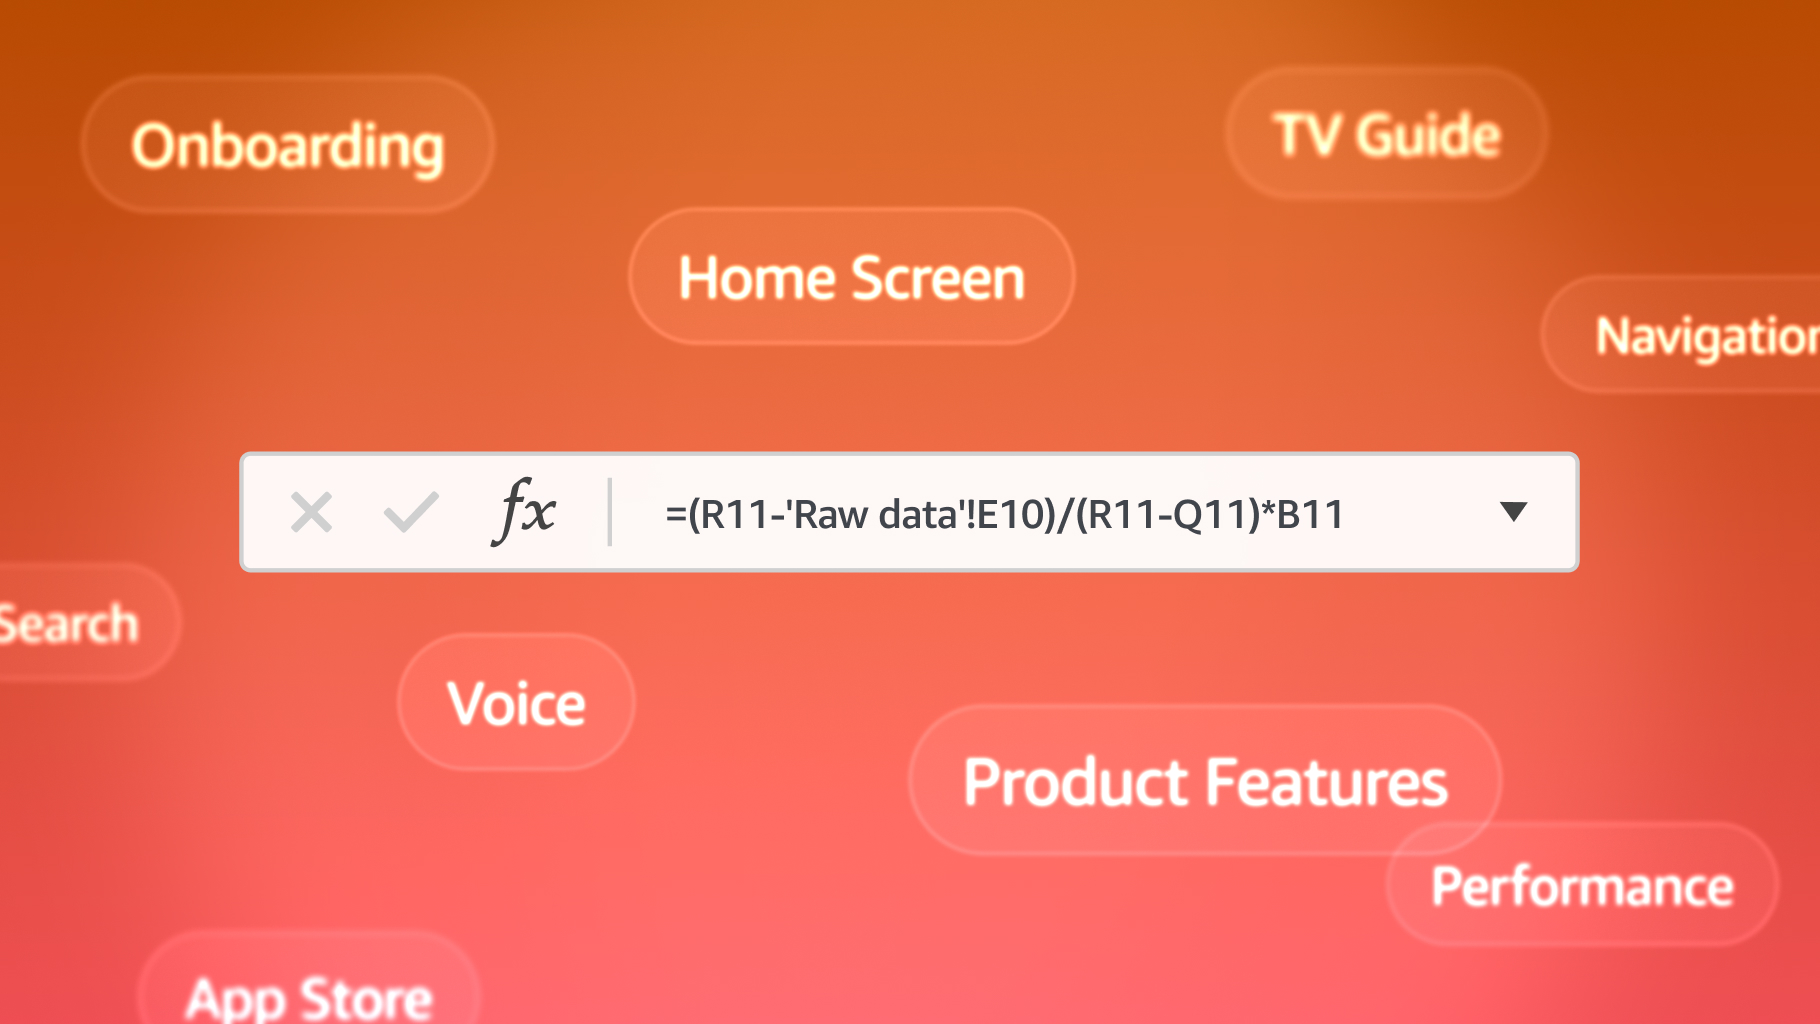
Research was divided into 9 categories:
- Onboarding
- Home Screen
- TV Guide
- Navigation
- Performance
- Product Features
- Search
- Voice
- App Store
Putting our methodology to the test
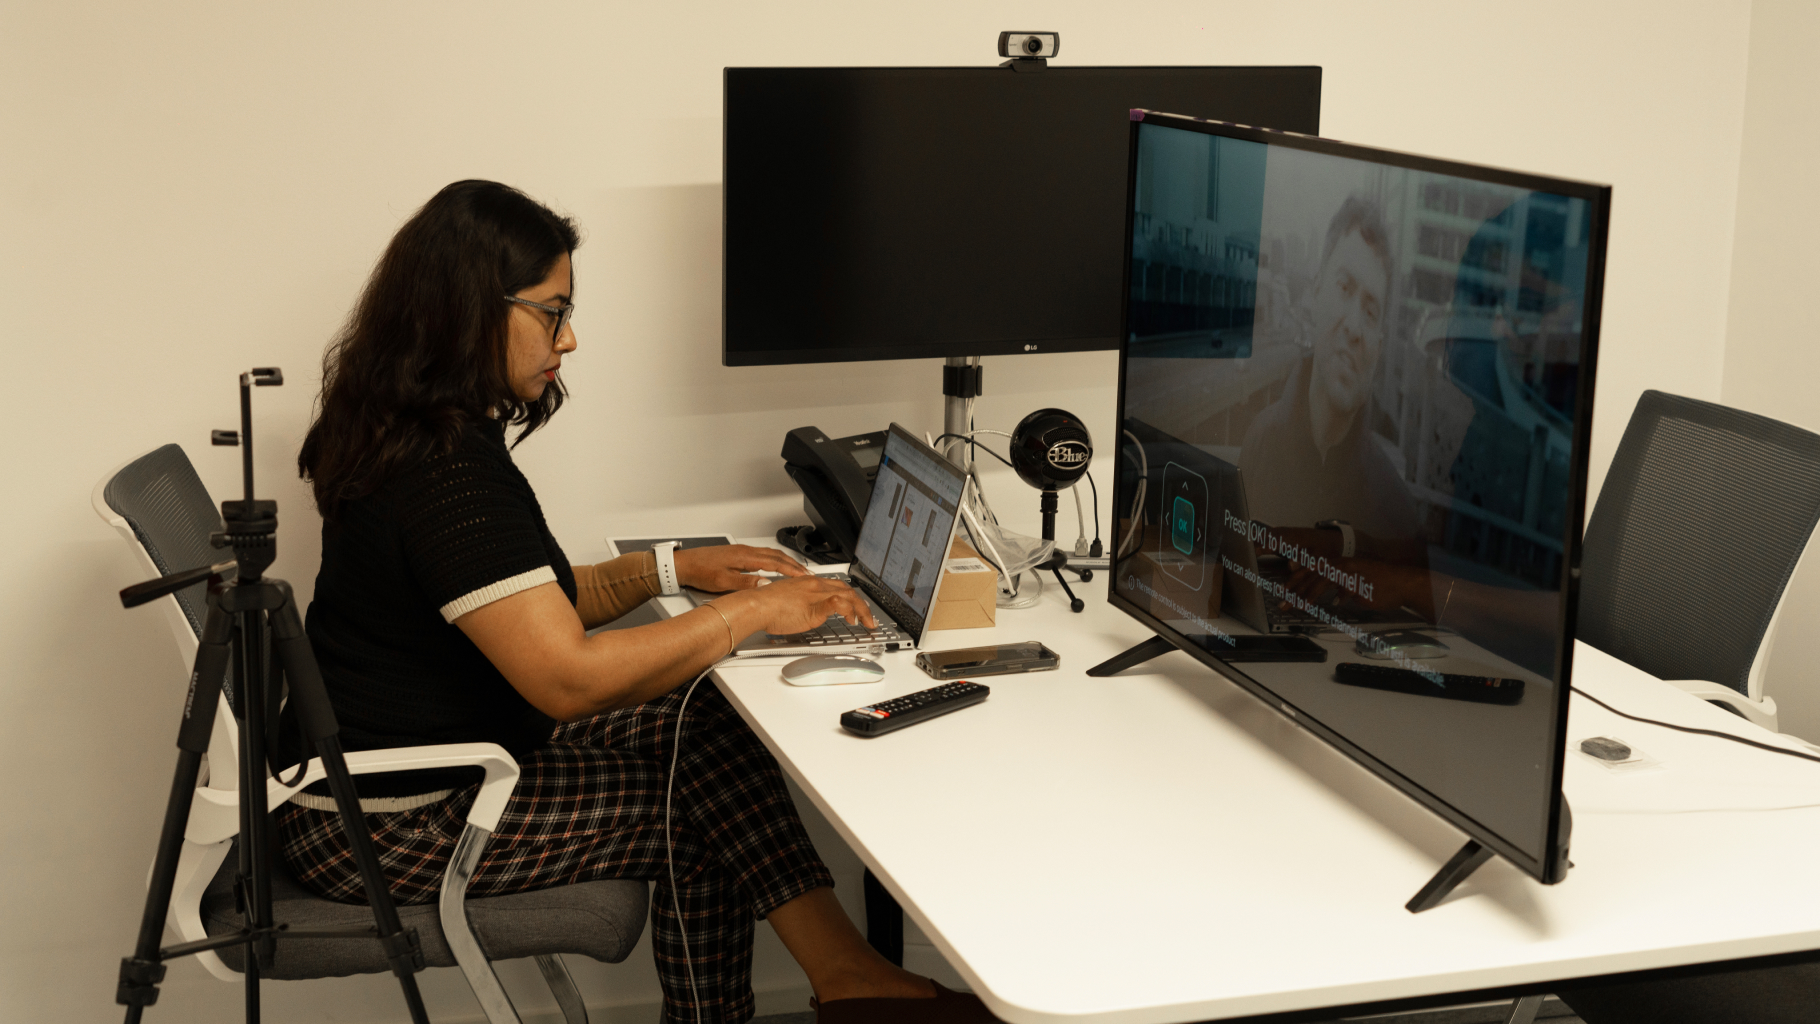
The testing facility in our London office was set up with additional testing also conducted in testers’ homes to replicate real world interactions. Our team behaved like new users of the test devices and SVODs, with each reset to its factory default for an out-of-box experience (OOBE). This allowed like-for-like comparisons in terms of setup times and areas such as PSB prominence on first-time use. We also followed the current convention of using second device to speed up the onboarding process, with devices matched where possible.
A quantitative test approach was used to avoid emotional responses, keep testing data driven and reduce ambiguity to a minimum. To ensure precise data capture, every interaction, e.g. remote taps and screens viewed, was timed and tracked to the millisecond. In addition, all tests were video recorded to allow results to be double-checked. Finally, testers made notes of any additional points of interest which were highlighted in review sessions.
Devices tested – each taking 3-days:
SMPs
- Amazon Fire TV Stick (Lite model 7.6.7.3)
- Google Chromecast
- Roku
- Apple TV+
Smart TVs
- Fire TV Edition (Toshiba D1NF-32-UK)
- Tizen OS Samsung
- WebOS LG
- Vidaa HiSense
- Roku TV OS Hisense
- Android TV
Gaming Devices
- Microsoft Xbox
- Sony PlayStation 5
Set Top Boxes
- Virgin Media
- Sky Q
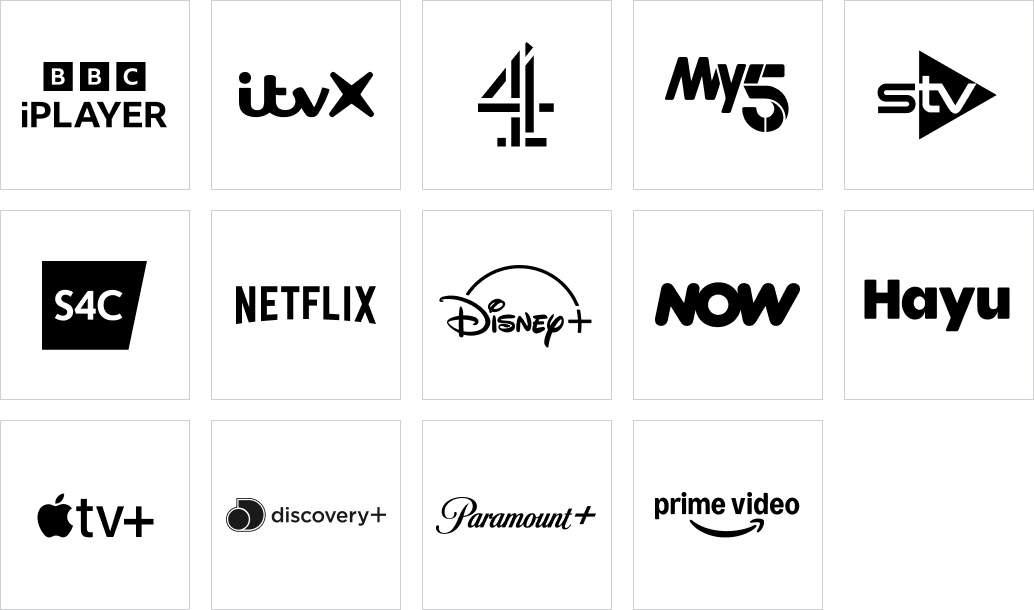
Streaming services tested
Taking a data-driven approach
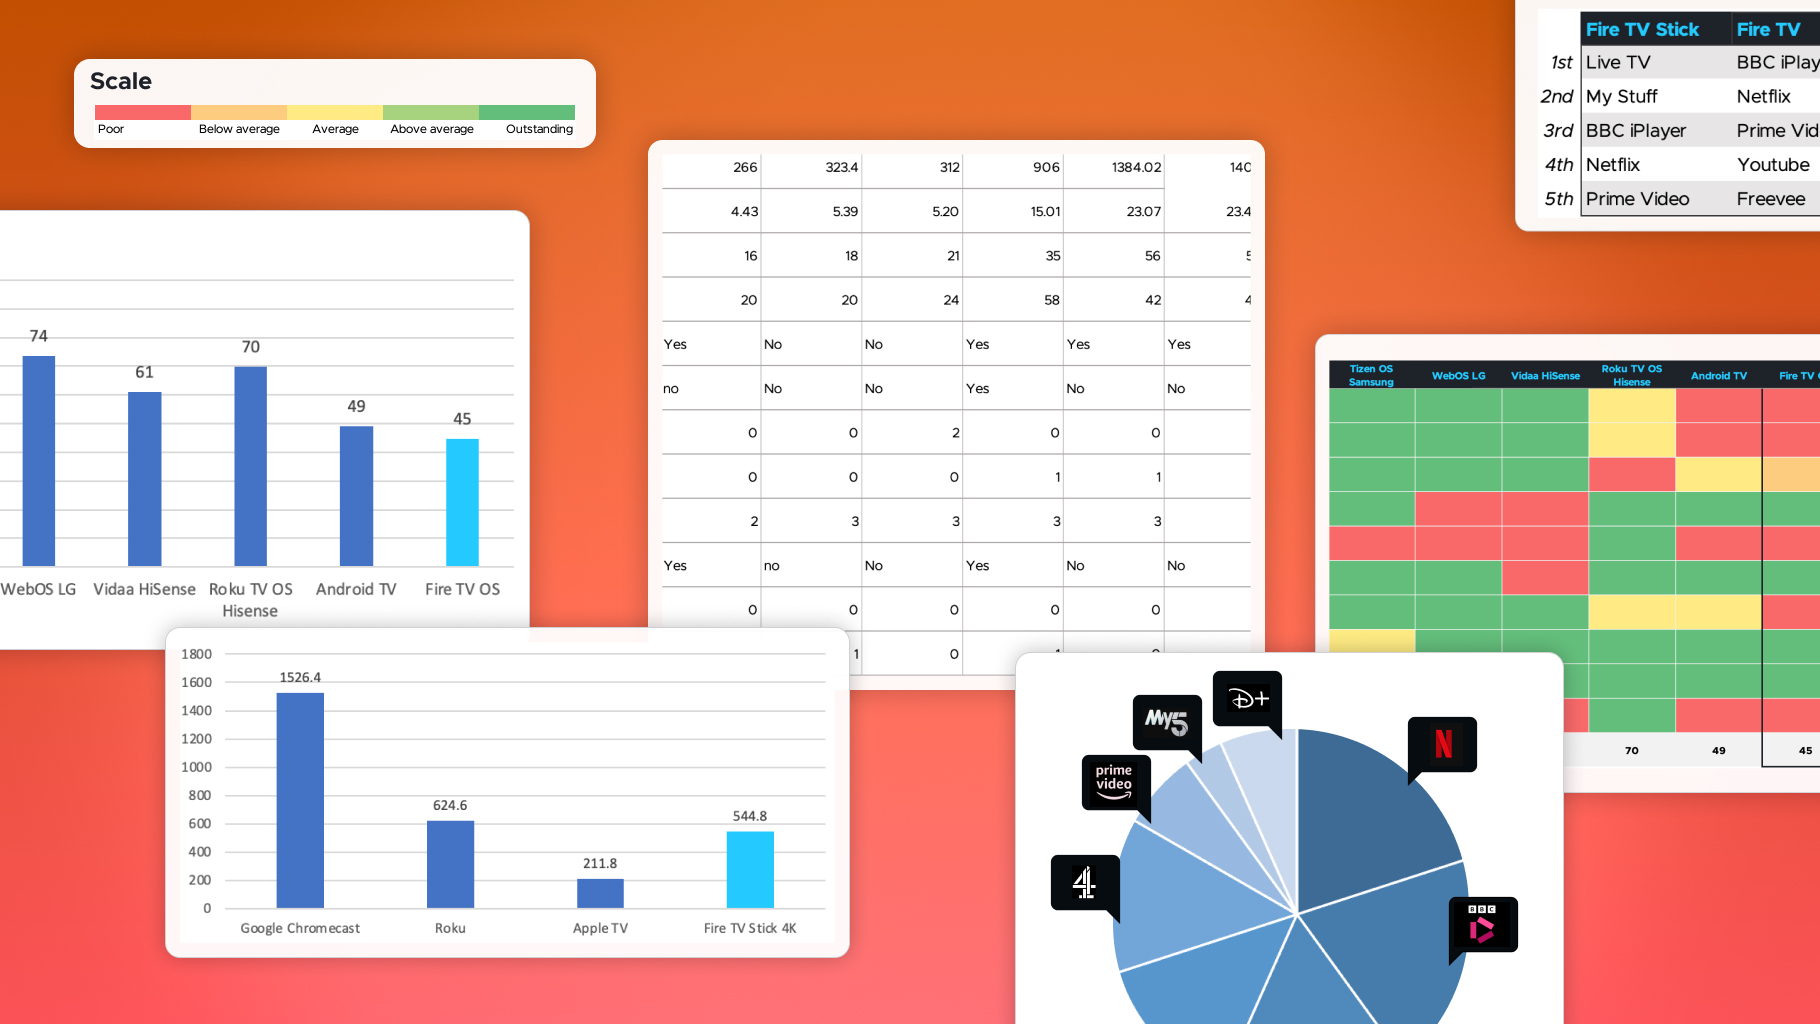
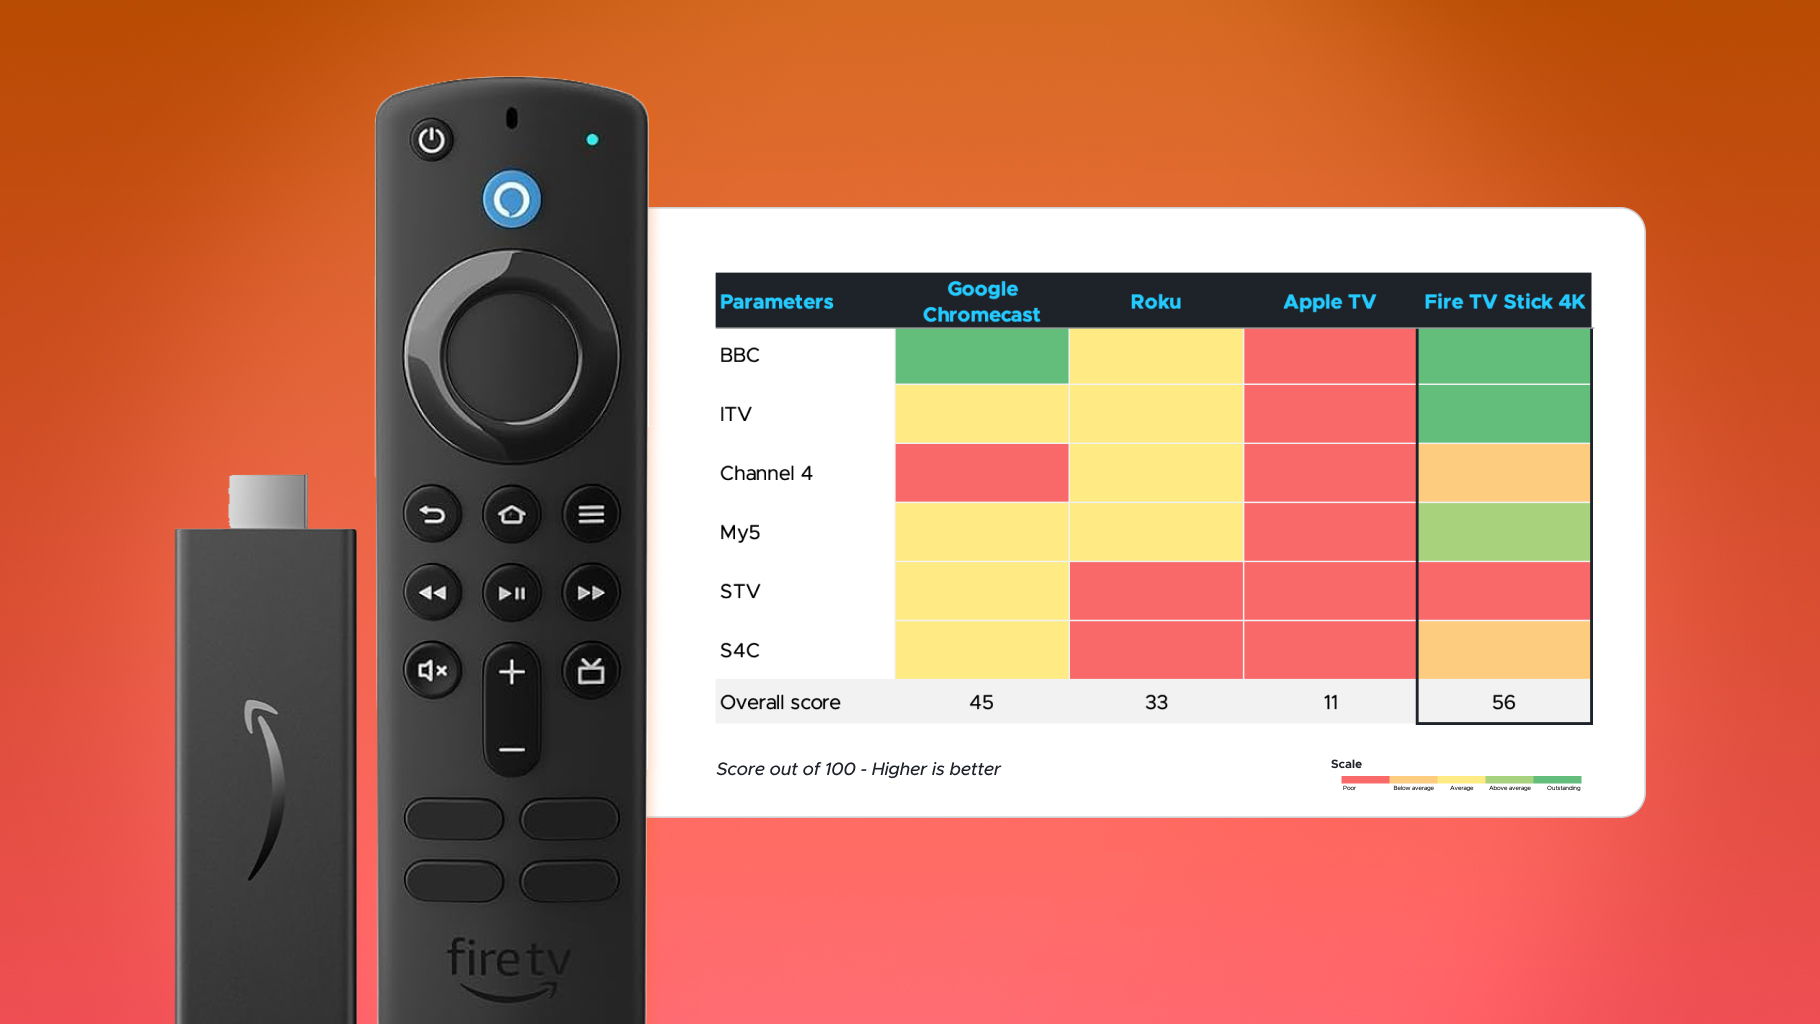
In total, over 3,000 pieces of data were collected. To ensure their safety, storage structures were created to protect against data breaches or losses. This information was duplicated and cleaned with results turned into a range of agreed data visualisations that included heatmap tables and charts.
Using big data to see the small detail
The team at Amazon are all about keeping things as clear and simple as possible. So, we took the original research document of over 300 pages and streamlined it down to 70. This began with all key findings summarised on a single page of A4. Then, if anyone wanted to know more about a specific area, they could dive further into the results.
Benchmarking that makes a difference
As per the agreed timescale, the final stage after 3 months of testing was presenting our findings to all relevant was presented to a wide range of Amazon stakeholders including Product, Tech, Marketing and Customer Experience teams.
We received fantastic feedback on both our testing methodology and results. Our final benchmarking document showed that Fire TV products scored well on PSB prominence, which was gratifying for them as they had worked hard on improving this. With regard to benchmarking against other devices, we confirmed internal thinking concerning the positioning of Fire TV products.
Individual departments within Amazon are now using the data we produced to evolve and improve Fire TV products, ensuring they maintain their position as a top UK streaming service provider.

